perf command-line, what is it? - Performance analysis tools for Linux. It covers hardware level (CPU/PMU, Performance Monitoring Unit) and software features (software counters, tracepoints)
# perf --helpHow to use it?
usage: perf [--version] [--help] COMMAND [ARGS]
The most commonly used perf commands are:
annotate Read perf.data (created by perf record) and display annotated code
list List all symbolic event types
record Run a command and record its profile into perf.data
report Read perf.data (created by perf record) and display the profile
sched Tool to trace/measure scheduler properties (latencies)
stat Run a command and gather performance counter statistics
timechart Tool to visualize total system behavior during a workload
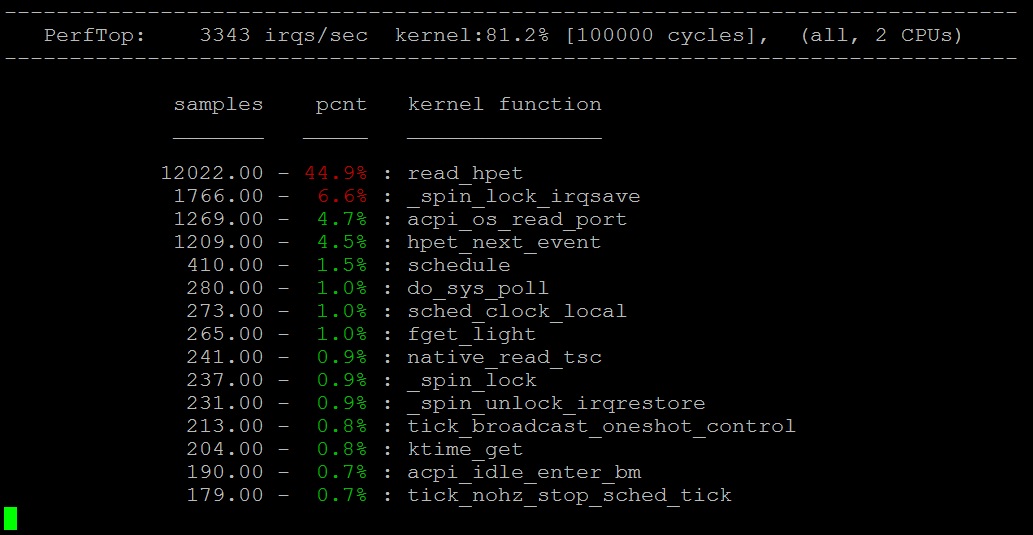
top System profiling tool.
trace Read perf.data (created by perf record) and display trace output
See 'perf help COMMAND' for more information on a specific command.
- Record profiles on all CPUs
# perf record -g -a- Produce all graph report based on the propfile
^C[ perf record: Woken up 54 times to write data ]
[ perf record: Captured and wrote 10.348 MB perf.data (~452130 samples)
# perf report -g
 other sample
# perf top
 This is something new what I learned from Oracle Linux. However, other command-line (latencytop,...)


2 comments:
by coincidence, I had another article in my RSS reader reader on perf and expanding to some other tools which look interesting too:
http://www.pixelbeat.org/programming/profiling/
thank you for great information.
Post a Comment